3D Printed Part Annealing Shrinkage Calculator

How to use this annealing estimator
This calculator predicts dimensional change from thermal expansion assumptions so you can plan design offsets before running annealing cycles. It is useful for print workflows where post-process shrinkage affects fit, tolerance, or assembly alignment.
Enter measured dimensions and material coefficient assumptions, then compare predicted contraction against your tolerance window. Use the visual overlay and mini-game as intuition tools, but rely on test coupons to calibrate material-specific behavior.
Why Visualizing Shrinkage Helps
The canvas above overlays the starting footprint with the shrunken version so the amount of contraction is immediately visible. Watching the blue rectangle recede inside the gray outline as you vary temperature or coefficient values builds intuition far faster than numbers alone. The caption echoes the dimensions so screen‑reader users gain the same insight.
Understanding Annealing and Shrinkage in 3D Prints
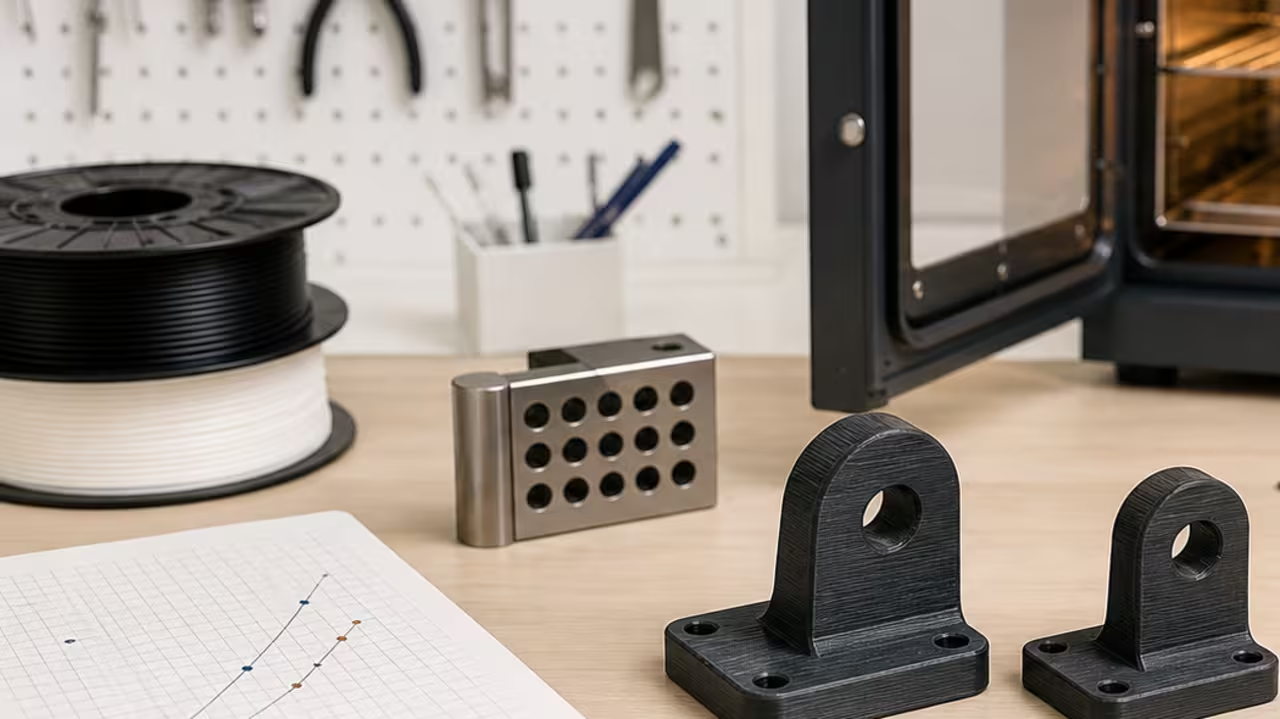
Many hobbyists and professionals anneal polymer 3D prints to relieve internal stresses, increase crystallinity, and improve mechanical properties. Materials like PLA, PETG, and nylon can benefit from carefully controlled heating cycles that allow polymer chains to rearrange into more stable configurations. However, as a part is heated above its glass transition temperature and then cooled, it undergoes dimensional changes. Predicting these changes is crucial when tight tolerances are required, such as for gears, enclosures, or components interfacing with metal parts. The shrinkage calculator estimates the final length of a part after annealing by applying the linear thermal expansion formula in reverse. If a material expands when heated, it contracts by the same proportion when cooling back to room temperature, provided it is not constrained. The equation is , where is the length at annealing temperature, is the original length at room temperature, is the coefficient of thermal expansion (CTE), and is the temperature change. Rearranging gives the final length after cooling: . The script performs this calculation and reports both the absolute shrinkage and the percentage change.
A detailed exploration of annealing begins with the molecular structure of thermoplastics. In fused filament fabrication, layers are deposited in a semi-molten state, bonding as they cool. Rapid cooling traps polymer chains in a non-equilibrium arrangement with residual stresses. When reheated during annealing, chains gain mobility and can realign into more ordered crystalline regions. This process often increases strength and heat resistance but simultaneously reduces volume. For semi-crystalline plastics like PLA, crystallization can cause shrinkage beyond that predicted by simple thermal contraction, as the density of the crystalline phase is higher than the amorphous phase. Consequently, the coefficient used in the calculator should account for both thermal expansion and crystallization effects. Empirical CTE values for annealing PLA typically range from 70–120 × 10⁻⁶ /°C, but effective shrinkage coefficients may be higher due to crystallization.
Understanding CTE is essential. The linear coefficient of thermal expansion describes how a material's length changes per degree of temperature change. Metals like aluminum have CTEs around 23 × 10⁻⁶ /°C, while polymers exhibit much higher values. For example, ABS is about 80×10⁻⁶ /°C and nylon around 100×10⁻⁶ /°C. The coefficient may vary with temperature; near the glass transition, polymers expand more rapidly. The calculator assumes a constant CTE over the temperature range between baseline and annealing temperature, which is a simplification but adequate for first-order estimates. Users seeking greater accuracy can perform test prints, measure actual shrinkage, and adjust the coefficient accordingly.
Worked Example
Consider a practical scenario: a PLA bracket measuring 100 mm by 40 mm is annealed at 80 °C. With a coefficient of 100×10⁻⁶ /°C and a temperature change of 55 °C, the contraction factor is . Multiplying yields final dimensions of 99.45 mm × 39.78 mm. The canvas shows the blue part shrinking evenly inside the gray outline, leaving about 0.275 mm of margin on each side.
Scenario Comparison Table
| Material | CTE (×10⁻⁶/°C) | Shrinkage over 60 °C |
|---|---|---|
| PLA | 100 | 0.60% |
| ABS | 80 | 0.48% |
| Nylon | 100 | 0.60% |
How to Interpret the Diagram
The gray rectangle depicts the original part at room temperature. The semi‑transparent blue overlay represents the size after annealing and cooling. Equal spacing around the blue shape indicates uniform shrinkage; unequal spacing signals anisotropy or missing input dimensions.
Limitations and Real-World Insights
Annealing protocols typically involve ramping up the temperature gradually, holding at the target for a set time, then cooling slowly to avoid warping. For PLA, common recommendations are 80–110°C for 30 minutes to an hour. PETG and nylon may require higher temperatures. The rate of heating and cooling can influence shrinkage as well. Rapid heating can create thermal gradients that cause uneven expansion, leading to deformation. Similarly, cooling too quickly can reintroduce internal stresses. The calculator assumes uniform temperature throughout the part, which is most accurate for small or thin components. Larger parts may experience differential shrinkage, and designers should consider oven circulation or even submerging parts in a heated medium like oil or sand to maintain uniformity.
Another complexity arises from fillers and reinforcing fibers. Many engineering filaments contain glass, carbon, or mineral additives to reduce shrinkage and improve mechanical properties. These fillers lower the overall CTE by constraining polymer matrix expansion. If you are using such materials, consult manufacturer data sheets for the appropriate coefficient. For example, glass-filled nylon might have a CTE around 30×10⁻⁶ /°C, dramatically reducing shrinkage compared to pure nylon. The calculator accommodates any coefficient, enabling experimentation with different filament formulations.
The explanation must also address measurement techniques. Accurate dimensional analysis requires calipers or micrometers with at least 0.01 mm resolution. When evaluating shrinkage, measure parts after they have fully returned to room temperature, as residual heat can cause temporary expansion. For high-precision applications, consider measuring along multiple points to account for non-uniform shrinkage. The calculator's single-value output should be interpreted as an average; real parts may deviate due to print orientation, infill percentage, or anisotropic material properties.
Beyond pure geometry, annealing influences mechanical performance. Increased crystallinity often raises tensile strength and heat deflection temperature. PLA parts that would soften at 60°C may withstand 100°C after proper annealing. However, increased brittleness can accompany these gains, especially if cooling is uncontrolled. The calculus of whether to anneal depends on the application's requirements. The calculator's focus on dimensional change fits into this broader decision-making process by quantifying one of the most tangible side effects of annealing.
In research and industrial settings, more advanced models incorporate viscoelastic relaxation and physical aging. These phenomena describe time-dependent strain even at constant temperature, meaning parts can continue to shrink slowly over weeks after annealing. While such nuances exceed the scope of this tool, the extended discussion acknowledges them to provide a comprehensive overview. Understanding that shrinkage may not stop immediately helps users plan for post-processing like machining or sanding after a stabilization period.
Finally, the calculator encourages iterative design. By printing small test coupons, annealing them, and measuring shrinkage, users can refine the coefficient and apply it to final parts with greater confidence. This empirical feedback loop is valuable because printed materials vary widely between brands and even color pigments. Combining empirical data with the theoretical framework discussed above empowers makers to push the limits of desktop manufacturing while maintaining dimensional accuracy.
Scaling in Three Dimensions
While the tool allows a single coefficient to be applied uniformly, real parts may shrink differently along each axis. Tall, thin components often contract more in height as gravity and layer orientation interact. To compensate, designers sometimes scale models by different percentages along X, Y, and Z before printing. After taking measurements from a few test pieces, you can derive separate coefficients for width and height and rerun the calculator with those values to preview multi‑axis behavior.
Some slicer software supports nonuniform scaling, letting you input factors like 100.5% in the X direction while keeping Y and Z at 100%. When combined with empirical shrinkage data, this approach yields parts that fit precisely after annealing. For mission‑critical assemblies, creating a shrinkage matrix that maps scaling factors to print orientation can dramatically reduce trial‑and‑error.
Annealing Schedules and Equipment
Dedicated filament ovens provide even heating, but many hobbyists repurpose kitchen appliances. Convection ovens with accurate thermostats work best. Always verify actual chamber temperature using an external thermometer; many consumer ovens fluctuate more than ±10 °C, which can distort parts. For small components, a heated build plate enclosed with an insulating box offers a makeshift annealing chamber with less overshoot.
Ramp rates influence internal stress. Increasing temperature by roughly 2–3 °C per minute and allowing similar cooling rates minimizes warping. Holding the part at a soak temperature for sufficient time—often 30–60 minutes depending on thickness—ensures the entire volume reaches equilibrium. Complex shapes may require longer dwell times or gradual positioning to prevent sagging.
Measuring and Compensating
Calipers capture linear dimensions, but more intricate parts may warrant 3D scanning or coordinate‑measuring machines (CMMs). When designing assemblies, consider adding small sacrificial test tabs adjacent to critical features. These tabs can be measured and trimmed to dial in correction factors without sacrificing the main part. Recording before‑and‑after measurements in a spreadsheet builds a historical database that sharpens future predictions.
Some makers prefer to design parts slightly oversized and machine them down after annealing. Although this adds post‑processing, it delivers tighter tolerances for components like bearings or sliding interfaces. The calculator’s percentage shrinkage output helps determine how much extra material to leave for final machining.
Material-Specific Considerations
Each polymer has an ideal annealing window. PLA typically responds well between 80–110 °C, ABS at 100–120 °C, PETG around 90–110 °C, and nylons at 70–90 °C with low humidity. Exceeding these ranges risks deformation or discoloration. Adding a small fan to circulate air prevents hotspots that could slump features. Manufacturer datasheets often list recommended heat‑treatment schedules; incorporating those values into the calculator improves accuracy.
Color additives and fillers can alter thermal behavior. Dark pigments absorb heat more readily, sometimes requiring lower setpoints to avoid over‑softening. Fiberglass or carbon fiber reinforcement reduces CTE, so default coefficients may overpredict shrinkage. Adjusting the coefficient or measuring a sample piece is the safest approach when working with exotic blends.
Safety and Handling
Annealing releases odors and, in some cases, fumes. Ensure adequate ventilation and avoid using food ovens for parts that may emit harmful compounds. Placing parts on parchment paper or a clean metal tray keeps them from sticking as plastic softens. Wearing heat‑resistant gloves prevents burns when transferring pieces in and out of the oven.
Glass transition temperatures can be surprisingly low; for instance, PLA begins to soften around 60 °C. Support complex parts with sand or plaster during annealing to maintain shape. If you plan to anneal frequently, consider building a dedicated insulated chamber with PID temperature control for repeatable results.
Advanced Modeling
Engineers seeking high fidelity may integrate shrinkage models into finite element analysis. By applying temperature‑dependent material properties, simulation software can predict deformation and residual stress before the first prototype is printed. Although such simulations require more expertise, they can save time for large batches or critical components.
Another approach is to fit empirical data to polynomial or Arrhenius‑type equations that describe how shrinkage evolves over time. These models extend the basic linear assumption and capture the accelerated contraction near a polymer’s crystallization point. Researchers developing new materials often publish these coefficients, allowing hobbyists to plug them into the calculator for more nuanced predictions.
Recording Your Results
After generating scaled dimensions, click “Copy Result” to store the measurements along with material and oven settings in a spreadsheet or lab notebook. Tracking shrinkage over multiple trials helps refine coefficients and improves print accuracy.
Related Calculators
Estimate material usage with the Filament Usage Estimator, dry filaments before annealing using the Filament Drying Time Calculator, or gauge structural impacts in the Porosity Strength Calculator.
Annealing Drift Lab Mini-Game
Drag the heat throttle and tap corrective pulses to keep shrinkage within tolerance. Each run reflects your current α and ΔT inputs so the oven feel mirrors the calculator.
Aim for ΔL = α·L·ΔT while the oven fights back.
Idle — input values to sync the challenge.