Projector Bulb Life-Cycle Cost Planner

Introduction
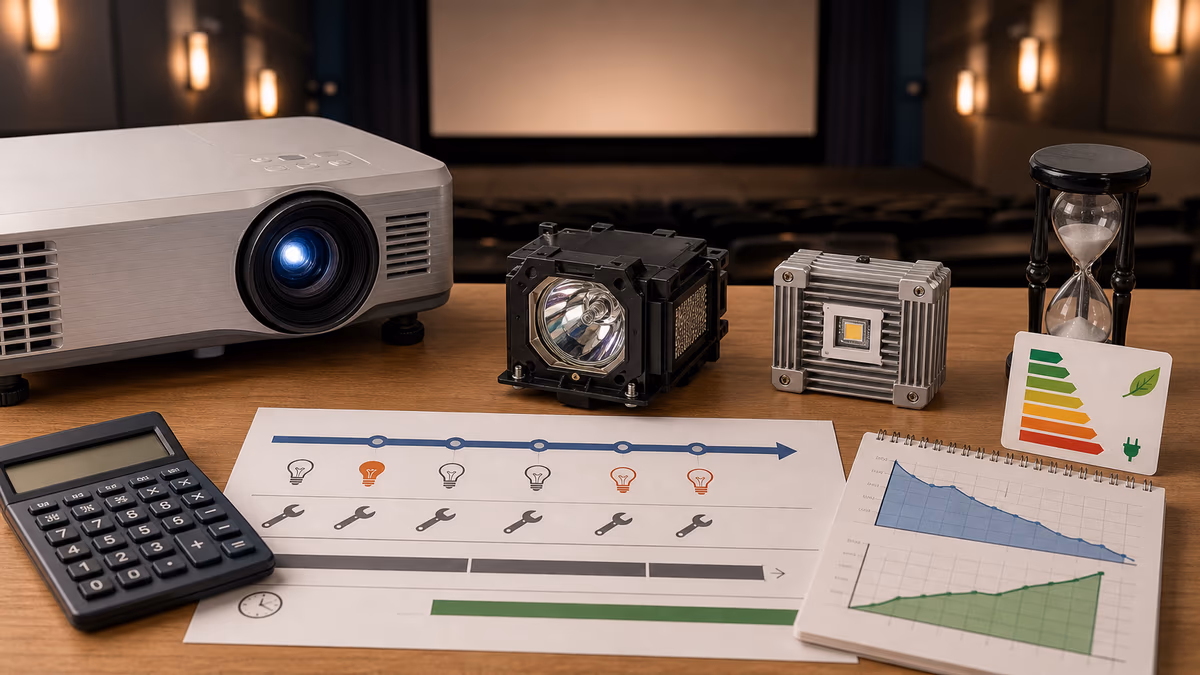
Projector brochures usually highlight brightness, resolution, contrast, and color performance. Those specs matter, but they do not tell you the full ownership story. A lamp-based projector may look affordable on day one and still become expensive over time because each lamp eventually dims, every replacement takes time, and any outage can interrupt a class, meeting, screening, worship service, or event. A solid-state projector with a laser or LED light engine often costs more upfront, yet it can avoid most routine lamp swaps and deliver steadier maintenance planning over a long service life.
This planner turns that tradeoff into numbers you can compare. It estimates the effective life of a lamp after you apply your own replacement threshold, then converts usage into annual hours, annual lamp purchases, labor, downtime, and electricity cost. It also calculates a simplified solid-state cost per hour by spreading the premium of a laser or LED model over the expected light-engine life. The result is not just a lamp price estimate; it is a clearer view of what one operating hour really costs in your environment.
That makes the calculator useful in several common situations. Facility teams can budget maintenance across multiple rooms. Schools can compare whether heavy classroom usage justifies moving to laser units. Businesses can decide whether meeting-room downtime is cheap enough to tolerate lamp changes or costly enough to avoid them. Home-cinema owners can use it as a planning tool when deciding whether a low purchase price today is worth the future stream of consumables.
How to use this planner
Start by describing the lamp-based projector you want to evaluate. Enter the replacement lamp cost, the rated lamp life, and the percentage of that rated life at which you actually plan to replace the lamp. That threshold matters because many owners do not wait for a lamp to reach absolute end of life. They replace earlier to keep brightness acceptable or to avoid failure during important events. If your real-world policy is to change lamps at 80% or 85% of rated life, the planner should reflect that instead of the marketing number printed on the box.
Next, describe how often the projector runs. Average daily usage and days of use per year determine annual operating hours. A projector used four hours a day for 220 days behaves very differently from one used ten hours a day nearly year-round. Then add the operating-cost details that are easy to overlook: power draw and electricity rate, any downtime or lost revenue caused by each replacement, and the labor time and labor value required to perform the change.
Finally, enter the price premium and life estimate for a solid-state alternative. The planner treats that premium as the extra amount you would pay to move from a comparable lamp-based projector to a laser or LED model. After you submit the form, read the results in this order: effective lamp life, expected replacements per year, annual cost categories, total annual cost, and cost per hour. Then compare the lamp-based figure with the solid-state figure. If you want a longer view, download the replacement schedule CSV to see how lamp changes accumulate year by year.
A helpful way to use the tool is to run two or three scenarios instead of trusting a single answer. Try an optimistic case with low downtime and cheap lamps, a conservative case with higher labor and earlier replacement, and a high-usage case that reflects busy periods. If the same choice looks better across all of those scenarios, your decision is probably more robust than one based on a single set of assumptions.
Key inputs and what they mean
- Replacement lamp cost: What you pay each time you buy a new bulb or lamp module.
- Rated lamp life: Manufacturer’s stated life in hours, usually until brightness falls to about 50% of the original level.
- Planned replacement threshold (%): The percentage of rated life at which you actually replace the lamp to maintain acceptable brightness or reduce risk.
- Average daily usage and days per year: Together these define your annual operating hours.
- Projector power draw and electricity rate: Used to estimate annual energy cost.
- Downtime or lost revenue per replacement: Any value lost while the projector is offline, such as canceled screenings, disrupted classes, or delayed presentations.
- Labor time and labor value: How long it takes to swap a lamp and the effective hourly cost of the person performing the work.
- Solid-state projector premium: The extra upfront cost of a laser or LED projector compared with a similar lamp-based model.
- Solid-state light engine life: The expected service life of the solid-state light source in hours.
Core formulas the calculator uses
The model starts by turning your usage pattern into annual operating hours:
Annual hours (Hannual) = Daily usage × Days per year
Effective lamp life is rated life multiplied by your replacement threshold:
Effective lamp life (Heff) = Rated lamp life × (Replacement threshold ÷ 100)
From this we derive how often you change lamps:
Replacements per year = Hannual ÷ Heff
Annual lamp cost, downtime cost, and labor cost are then:
Lamp cost per year = Replacements per year × Lamp cost
Downtime cost per year = Replacements per year × Downtime per replacement
Labor cost per year = Replacements per year × Labor time × Labor rate
Electricity cost is based on power draw, runtime, and utility rate:
Energy per year (kWh) = (Projector watts ÷ 1000) × Hannual
Electricity cost per year = Energy per year × Electricity rate
The calculator then combines these into a cost per operating hour:
For solid-state projectors, there is usually no routine lamp replacement. Instead, the planner spreads the solid-state premium over the expected life of the light engine and combines that with any modeled electricity cost:
Solid-state cost per hour ≈ Solid-state premium ÷ Solid-state life
That comparison is intentionally simple. It is meant to answer a practical question: how much recurring cost is attached to each hour of light output, and at what usage level does a higher upfront purchase begin to pay back?
Worked example
Suppose you run a projector for 4 hours per day over 220 days per year. The lamp is rated for 3,500 hours, but you choose to replace it at 85% of rated life to avoid visible dimming and reduce the chance of a bad failure during use. Each lamp costs $220. You estimate downtime at $75 per replacement, labor at 0.5 hours per change, and labor value at $40 per hour. The projector draws 320 watts, and electricity costs $0.17 per kWh.
First calculate annual hours:
Hannual = 4 × 220 = 880 hours/year
Then calculate effective lamp life:
Heff = 3,500 × 0.85 = 2,975 hours
Expected replacements per year become:
Replacements per year = 880 ÷ 2,975 ≈ 0.30
That means, on average, you would replace the lamp about once every 3.4 years. The annualized lamp cost is therefore:
Lamp cost per year = 0.30 × $220 ≈ $66
Now add service impact:
Downtime per year = 0.30 × $75 ≈ $22.50
Labor per replacement = 0.5 × $40 = $20
Labor per year = 0.30 × $20 ≈ $6
Electricity works out to:
Energy per year = (320 ÷ 1000) × 880 ≈ 281.6 kWh
Electricity cost per year = 281.6 × $0.17 ≈ $47.87
Total annual cost and cost per hour are then:
Total yearly cost ≈ 66 + 22.50 + 6 + 47.87 ≈ $142.37
Cost per hour ≈ $142.37 ÷ 880 ≈ $0.16/hour
Now compare that with a solid-state projector that costs $1,800 more but has a 20,000-hour light engine. The premium alone spreads to about $1,800 ÷ 20,000 ≈ $0.09/hour. In this simplified case, the higher sticker price can still be economically attractive because it avoids routine lamp purchases and much of the service disruption that comes with them. The exact answer changes with your own usage, replacement policy, and downtime value, which is why scenario testing is so useful.
Interpreting the results
After entering your numbers, focus on the outputs as a story rather than as isolated figures. Effective lamp life tells you how much of the manufacturer’s rating you are really using. Replacements per year translates that into maintenance cadence. The annual cost categories reveal what is actually driving ownership cost: consumables, service interruption, labor, or electricity. Finally, the cost-per-hour comparison shows whether a lamp-based projector remains economical under your workload or whether a solid-state premium begins to make sense.
- Replacement cadence: How many times per year, or every how many months or years, you should expect to replace the lamp.
- Total annual cost and cost per hour: The combined effect of consumables, downtime, labor, and electricity.
- Comparison with solid-state: Whether the extra upfront cost of a laser or LED projector is justified by lower operating cost over time.
As a rule of thumb, high-usage installations and environments with meaningful downtime cost tend to favor solid-state sooner. Light-usage rooms with inexpensive lamps and little operational risk often continue to favor lamp-based projectors. Neither result is universally right; the best answer depends on how and where the projector is actually used.
Lamp-based vs. solid-state projectors: summary comparison
| Aspect | Lamp-based projector | Solid-state projector (laser or LED) |
|---|---|---|
| Upfront cost | Lower purchase price | Higher purchase price, with the premium captured in the calculator inputs |
| Light source life | Typically 2,000 to 5,000 hours, with effective life often lower due to earlier replacement | Often 15,000 to 30,000 hours before major brightness decline |
| Recurring consumable cost | Regular lamp purchases plus labor and downtime | No routine lamp changes; the light engine is usually not treated as a recurring consumable |
| Brightness stability | Noticeable dimming over time, which may force replacement before full rated life | More gradual brightness decay and usually fewer maintenance interruptions |
| Best fit | Lower usage, tighter purchase budgets, or spaces where downtime is minor | Heavy usage, mission-critical rooms, or installations where service access is costly |
Assumptions and limitations
This planner is a simplified financial model, so it is best treated as a planning tool rather than an exact forecast. It assumes your average usage pattern is representative over time and that lamp aging can be summarized with a practical replacement threshold. It does not simulate every nuance of brightness decay, color shift, random failure, warranty replacement, or changing energy tariffs.
- Constant usage: Average daily hours and days per year are assumed to remain reasonably stable.
- Smooth lamp aging: The model treats the lamp as usable until your chosen threshold, even though real lamps dim gradually.
- No discounting or inflation: Future lamp purchases, labor, and electricity are not discounted for time value of money and do not include inflation.
- No failure variability: Early failures, defective lamps, and warranty scenarios are not explicitly modeled.
- Single-power assumption: Power draw is treated as constant even though eco modes and different brightness settings may change it.
- Simplified solid-state modeling: The solid-state premium is spread over light-engine life without adding residual value, financing, or repair detail.
- Non-financial factors: Image quality, fan noise, heat, and environmental impact are outside the scope of the numeric result.
If you are making a large fleet purchase, you may want to follow this quick model with a more detailed total-cost-of-ownership review. Even then, this planner is still useful because it highlights which assumptions matter most and where a small change in downtime or lamp policy can swing the decision.
How to act on the planner’s results
Once you have a result and, if useful, a downloaded replacement schedule CSV, turn the output into an action plan. Compare the calculated cost per hour of your current lamp-based projector with the modeled solid-state alternative. If solid-state is already cheaper per hour, the premium may be easier to justify. If the lamp-based option still looks cheaper, note which variable is doing most of the work. It may be low usage, inexpensive lamps, or very little downtime cost.
- Budget for upcoming lamp purchases and service windows around the expected replacement cadence.
- Test how sensitive the decision is by changing downtime cost, labor rate, or replacement threshold.
- Use the annual electricity figure when comparing rooms with long operating hours.
- Share the cost-per-hour result with purchasing or facilities teams so the decision is based on ownership cost, not only purchase price.
The more realistic your inputs are, the more useful the comparison becomes. A projector used occasionally in a spare room and a projector used daily in a lecture hall can produce very different financial answers even when the hardware itself looks similar on paper.
Mini-game: Lamp Swap Sprint
Want a fast, hands-on feel for the replacement threshold tradeoff? In this optional mini-game, each room’s projector fades from bright green toward dim red. Replace each lamp when its gauge enters the gold target zone. Swap too early and you waste useful lamp life. Wait too long and the room goes dim, which is exactly the downtime penalty this planner is designed to measure.
Educational takeaway: the lowest operating cost usually comes from balancing wasted lamp life against downtime risk, not from blindly chasing the longest possible lamp run.