
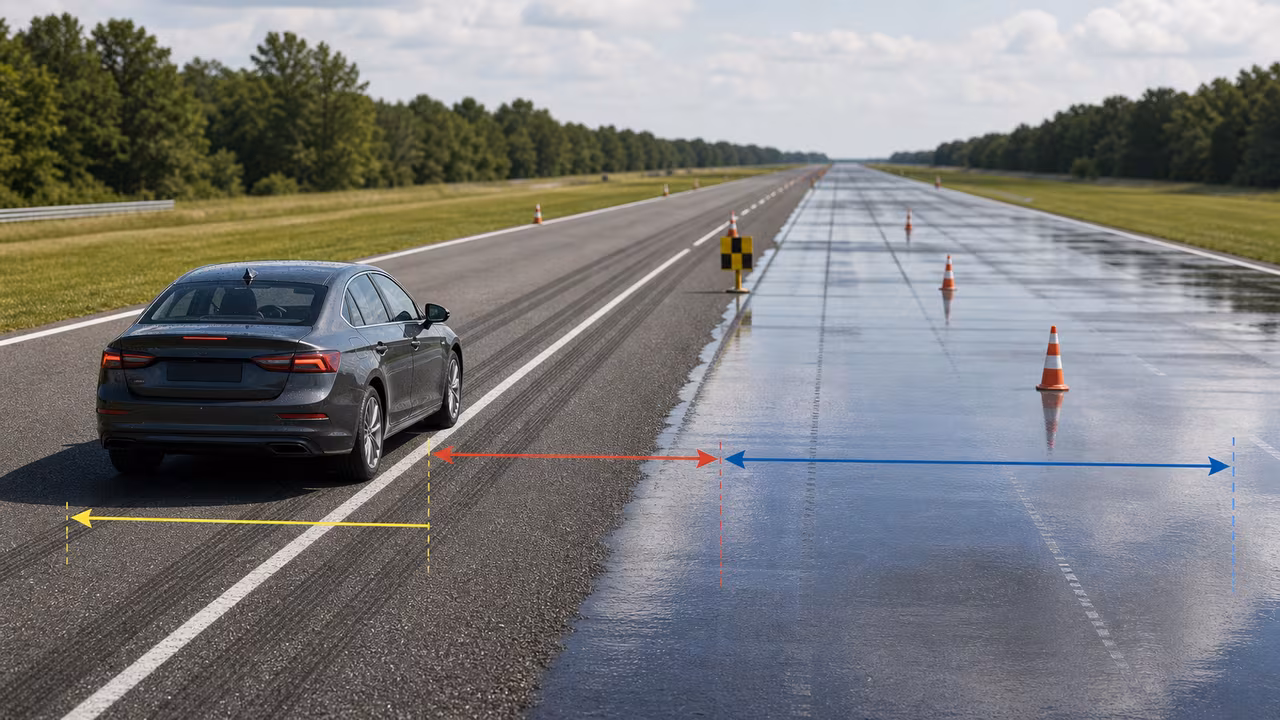
Reaction distance and braking distance, added together
When you spot a hazard, the car keeps rolling before anything slows it down. That first stretch — while your brain registers the problem and your foot reaches the pedal — is reaction distance. Only once the brakes bite does the car start shedding speed against tire grip, and that second stretch is braking distance. Add the two and you have the road you actually need to come to a stop. Everything here is metric: speed in km/h, reaction time in seconds, grip as a friction coefficient (μ), and distances in metres.
Three inputs drive the answer. Speed is how fast you are going the moment the hazard appears. Reaction time is how long you spend perceiving and responding — roughly 1.0–1.5 s when you are alert and half-expecting to brake, and noticeably longer when you are tired, distracted, or genuinely surprised. Friction μ is the usable grip between tire and road: about 0.7–0.8 on dry asphalt, 0.4–0.6 when it is wet, 0.2–0.3 on packed snow, and as little as 0.1 on ice. Results refresh as you type, so it is easy to pin two values and sweep the third — say, hold 90 km/h steady and watch the total swing as μ falls from 0.75 to 0.35.
The formula, and why a little more speed costs so much road
The model treats the road as level and the deceleration as steady. First convert speed to metres per second with v = speed ÷ 3.6, then split the stop into its two parts. Reaction distance is simply speed multiplied by time, d_reaction = v × t, which grows in a straight line. Braking distance comes from the car's kinetic energy divided by the braking force it can generate:
with g ≈ 9.81 m/s², and the total is D = d_reaction + d_brake. The decisive detail is that v² on top: braking distance climbs with the square of speed, so going from 80 to 100 km/h — only 25% faster — stretches the braking portion by more than half. Grip sits in the denominator, so cutting μ in half roughly doubles the braking distance at the same speed. That single number, μ, is not a fixed property of the road; it shifts with tire compound, tread depth, temperature, and how much water sits on the surface.
Put numbers to it: at 90 km/h on dry asphalt (μ = 0.70) with a 1.5 s reaction, v = 25 m/s. Reaction distance is 25 × 1.5 = 37.5 m, braking distance is 25² ÷ (2 × 0.70 × 9.81) ≈ 45.5 m, and the total lands near 83 m. Now drop μ to 0.40 for a wet road: the braking part alone jumps to about 80 m even though your reaction time never moved. That gap — same speed, worse grip — is why a familiar car can feel like a completely different machine in the rain.
Where this simple model stops being accurate
The estimate is deliberately clean, and that cleanliness leaves out several things that matter once you are actually on the road:
- No grade. The road is treated as flat; a downhill stretch lengthens the stop and an uphill one shortens it.
- Constant grip. μ is one value for the whole stop, but real grip changes with standing water, ice patches, tire wear, and temperature.
- No brake fade. Long or repeated braking heats the brakes and quietly reduces their bite.
- Tire and ABS nuances ignored. Load transfer, tire compound, and how ABS modulates pressure all shift the deceleration you can really reach.
- Not for legal or engineering use. Accident reconstruction and vehicle certification need measured data and professional methods, not a teaching estimate.
Read the output as a floor for building intuition, not a guarantee, and leave yourself margin. A good exercise is to pick a speed you drive often and compute it three ways — dry (μ ≈ 0.75), wet (μ ≈ 0.50), and icy (μ ≈ 0.15) — first with a 1.0 s reaction and then with 2.0 s. Seeing the totals side by side makes the case for slowing down in bad conditions far better than any rule of thumb. The NHTSA speeding page makes the same point from the safety side: speed drives both stopping ability and crash severity. If you think in mph, multiply by 1.609 to reach km/h (50 mph ≈ 80 km/h, 70 mph ≈ 113 km/h).
Questions drivers actually ask
Why does braking distance grow faster than my speed does?
Because it depends on v². Reaction distance rises in step with speed, but braking distance rises with speed squared, so a 20% bump in speed can add far more than 20% to the road you need. That is the single biggest reason small speed reductions pay off so well on the highway.
How much do wet or icy roads really change things?
A lot, because braking distance is inversely proportional to μ. Halving grip — dry asphalt at 0.7 down to a wet 0.35 — roughly doubles the braking portion for the same speed. Ice, near μ = 0.1, can multiply it several times over, which is why the calculator's total can look alarming at winter grip levels.
Can I use these results for legal or engineering work?
No. This is a learning and comparison tool built on a simplified level-road model. Accident reconstruction, compliance testing, and vehicle design all require measured data and established professional methods.
Does ABS shorten my stopping distance?
Mainly it keeps you steering while braking hard and helps many drivers reach near-maximum braking on mixed surfaces. It does not manufacture grip — the deceleration ceiling is still set by tire-road friction, exactly the μ you enter above.
Copy feedback will appear here after you copy a result.
Brake Reflex Rally Mini-Game
Click, tap, or press space to brake exactly where physics says you should.
Tune your speed, reaction time, and grip above to set the challenge.
Pointer or spacebar brakes. Runs last about 75 seconds; best score is saved locally.
Accessibility note: the mini-game is optional and does not affect the calculator. If you prefer not to play, you can ignore this section and use the results above. If you do play, the target line is based on the same total stopping distance shown in the results, so changing speed, reaction time, or μ changes the challenge immediately.